Data in a physical context
We’ve seen this sort of thing before, but it doesn’t ever seem to get old. Peter Ørntoft takes some data and puts it into physical context:
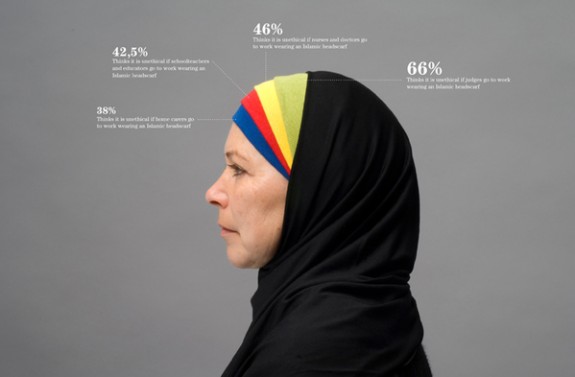
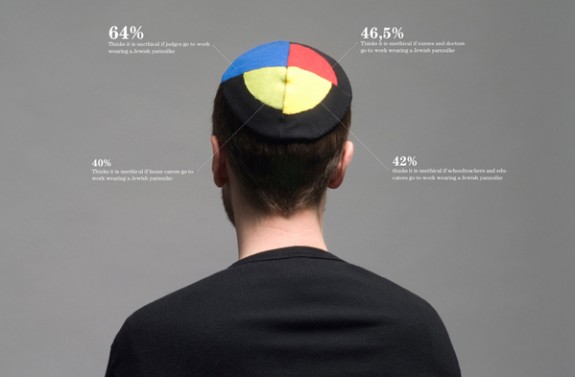
The project deals with data from a list of the social related interests of the Danish people. The list is the result of an opinion poll from a major consultancy company in Denmark. I have used the context of specific opinion polls within each interest to shape and design diagrams. By doing so the receiver understands more layers of information about the data.
The graphics above and below show Danish opinion on whether it’s ethical to wear religious symbols in public professions. At their core, they’re just pie charts. Embed them on clothing relevant to the topic though, and somehow they become more than that.

What do you think – does it lend to better understanding, or at the very least, make you care more?
[Behance via Chart Porn]—
Learn data. Pre-order the FlowingData book.

